Credits
Photo and data credits.
The photographs on this site, and the open data behind the footprint calculator, with their authors and licences.
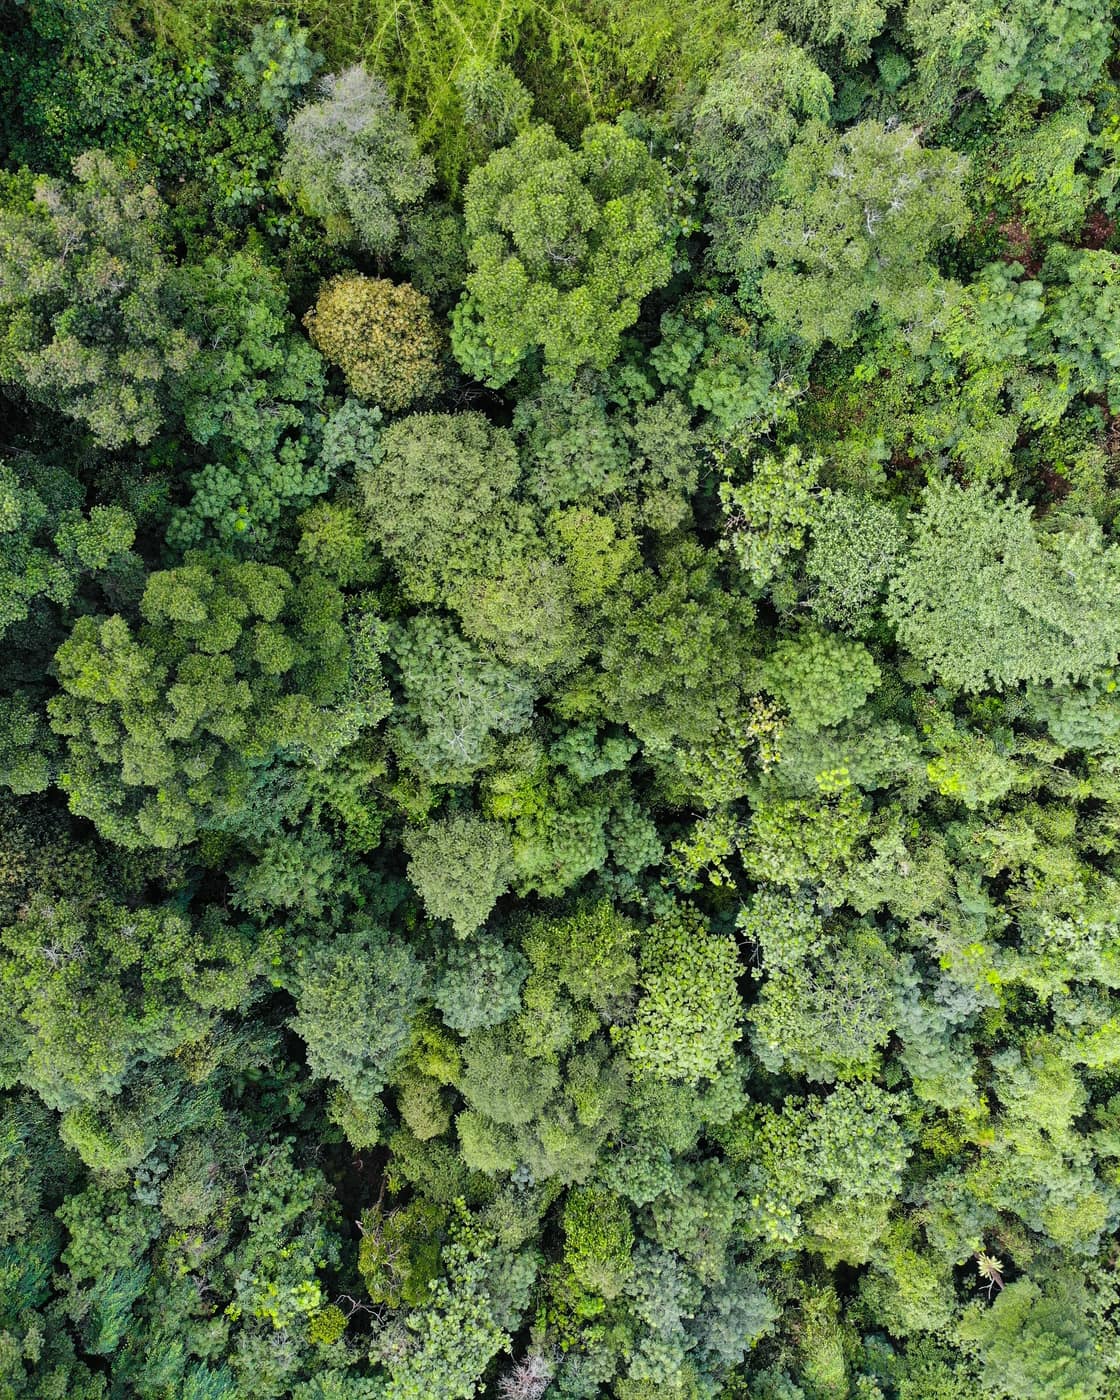
Rainforest canopy seen from directly above
Photo by Omar Elsharawy on Unsplash. Unsplash License.
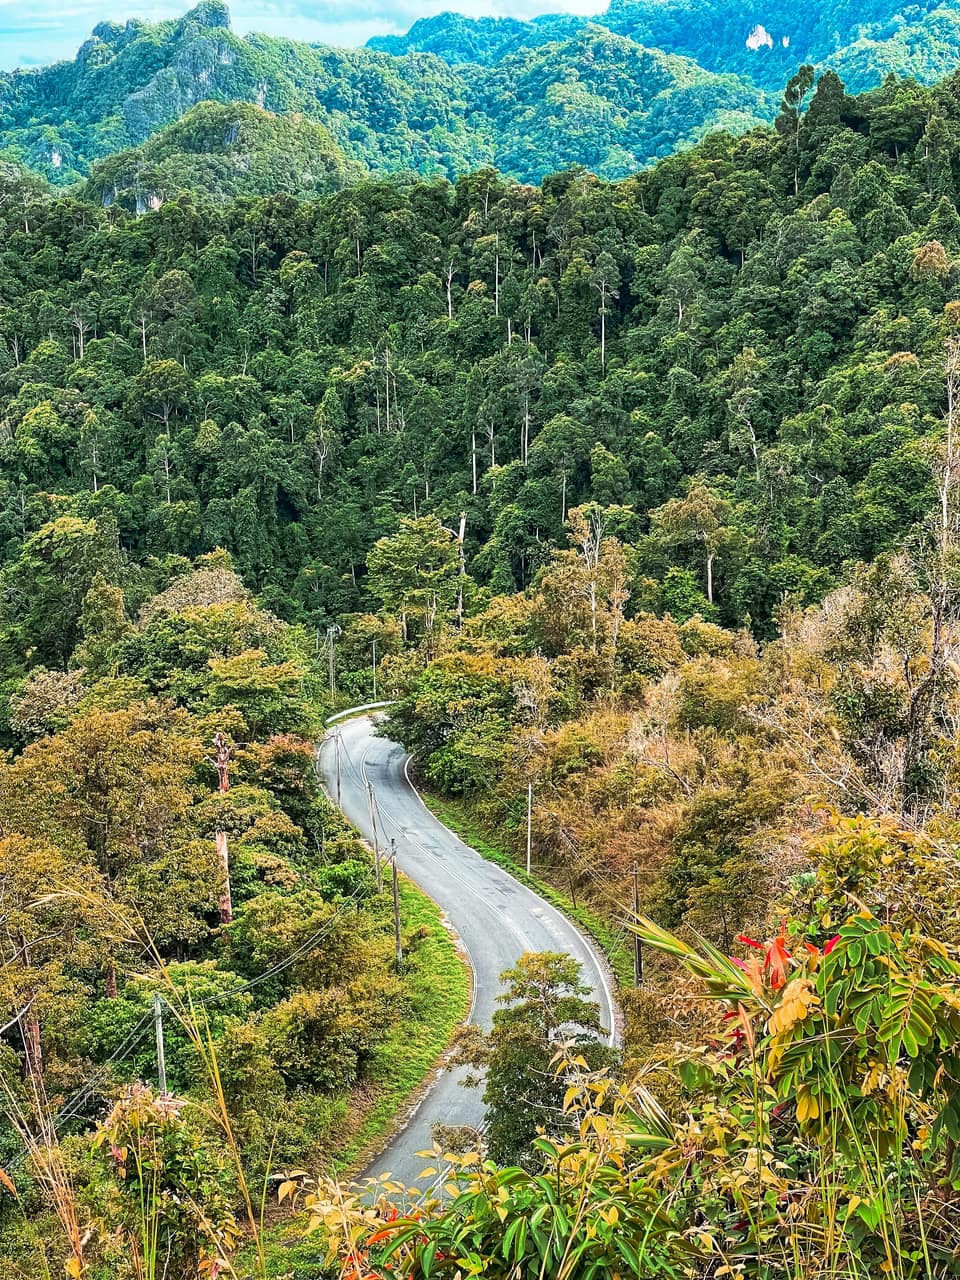
A road winding through rainforest, seen from above
Photo by Iffah Ishak on Unsplash. Unsplash License.
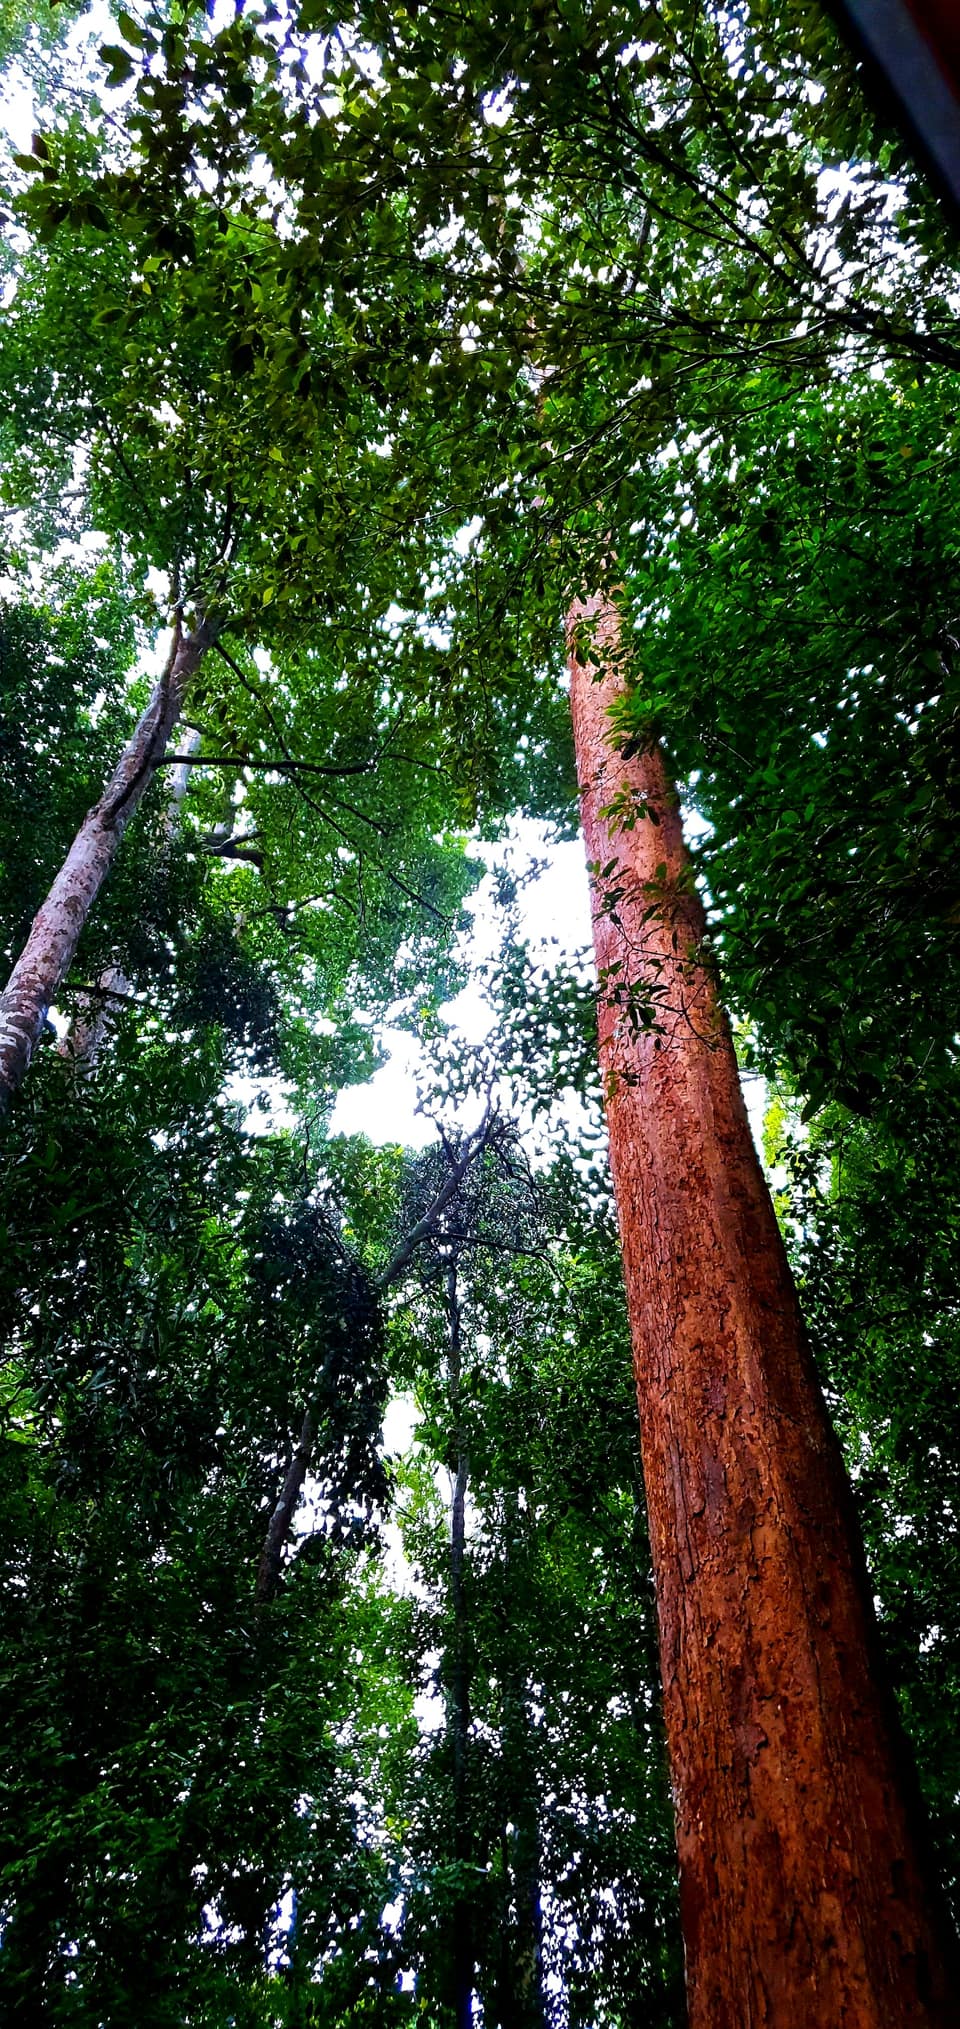
Looking up the trunk of a tall rainforest tree into the canopy
Photo by Muhammad Zamani on Unsplash. Unsplash License.
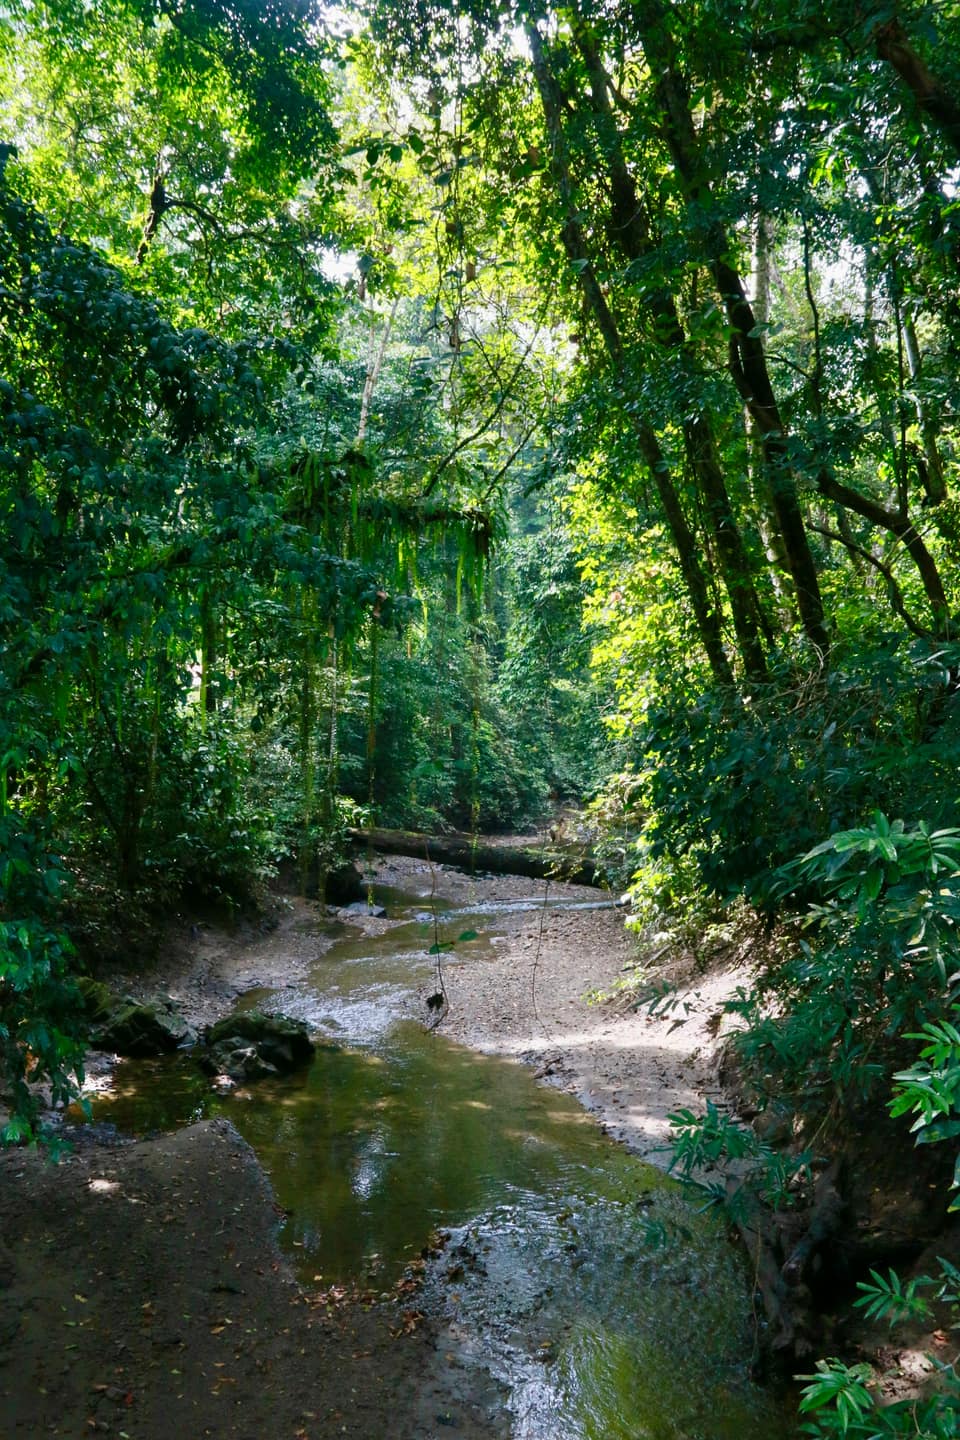
A stream running through dense rainforest
Photo by Polina Koroleva on Unsplash. Unsplash License.
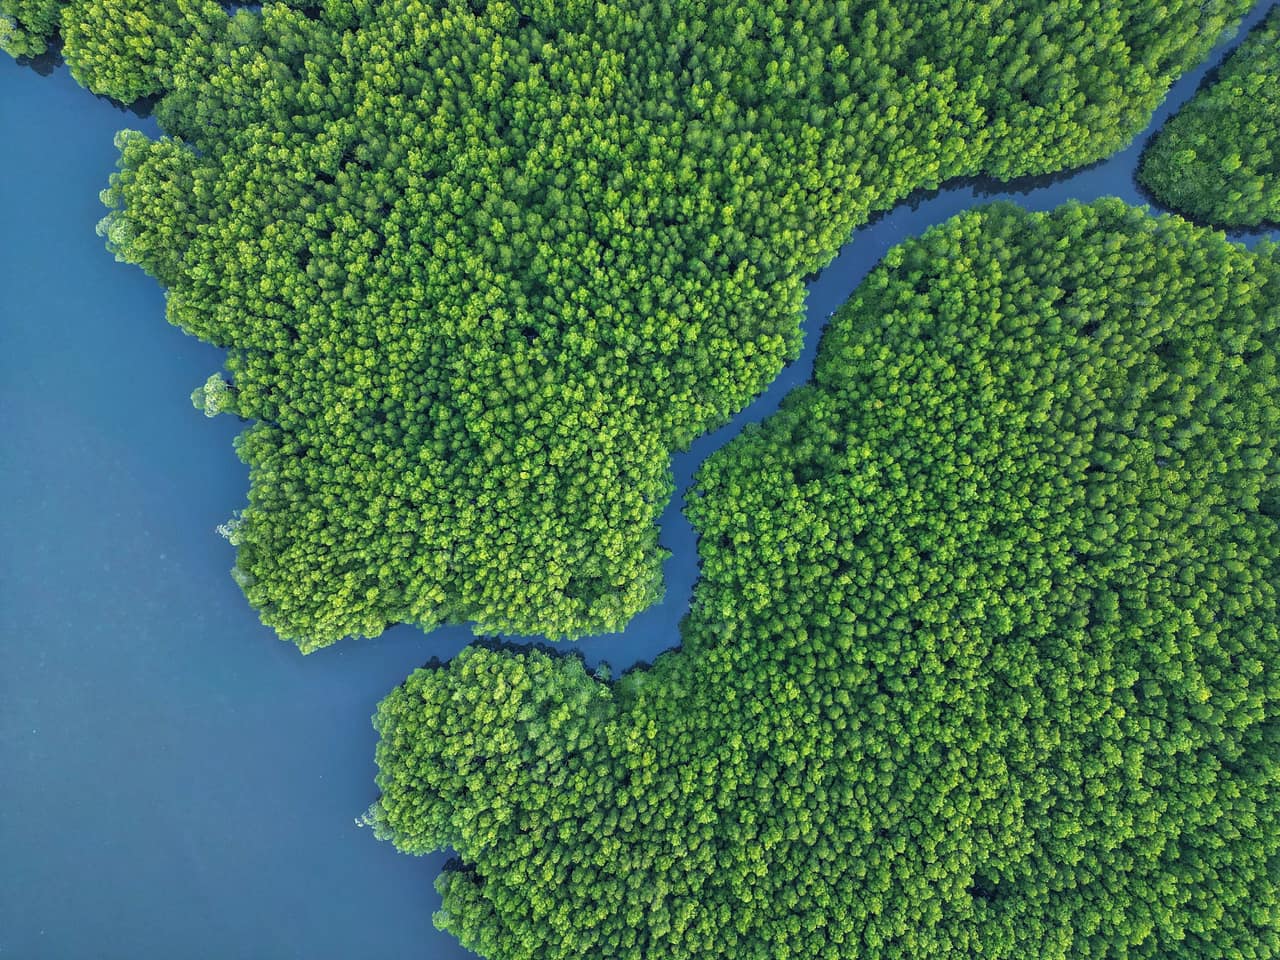
Mangrove forest and a tidal channel seen from above
Photo by Laszlo Oveges on Unsplash. Unsplash License.
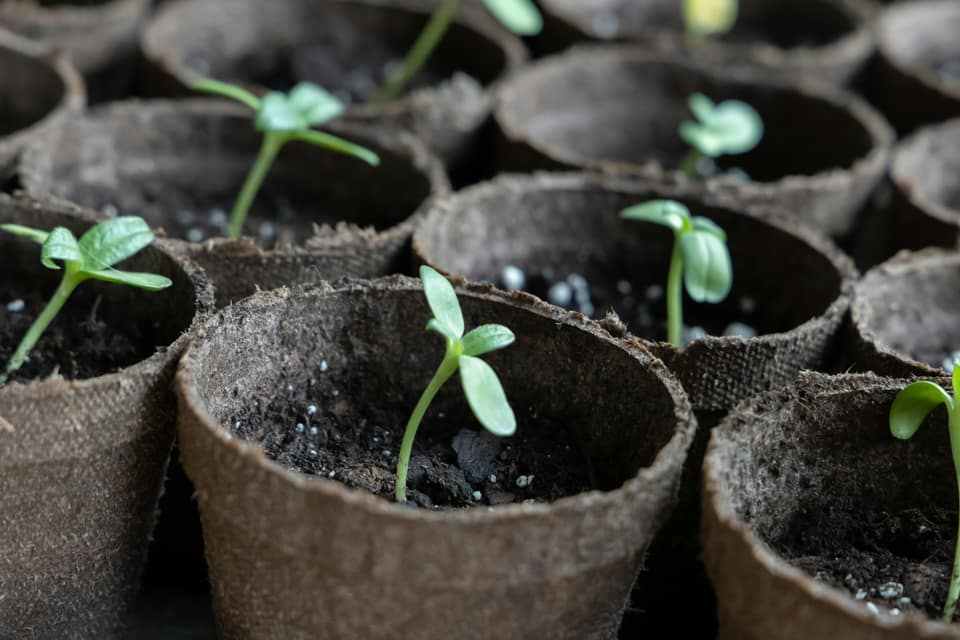
Seedlings sprouting in fibre pots
Photo by Rachel Reinhardt on Unsplash. Unsplash License.
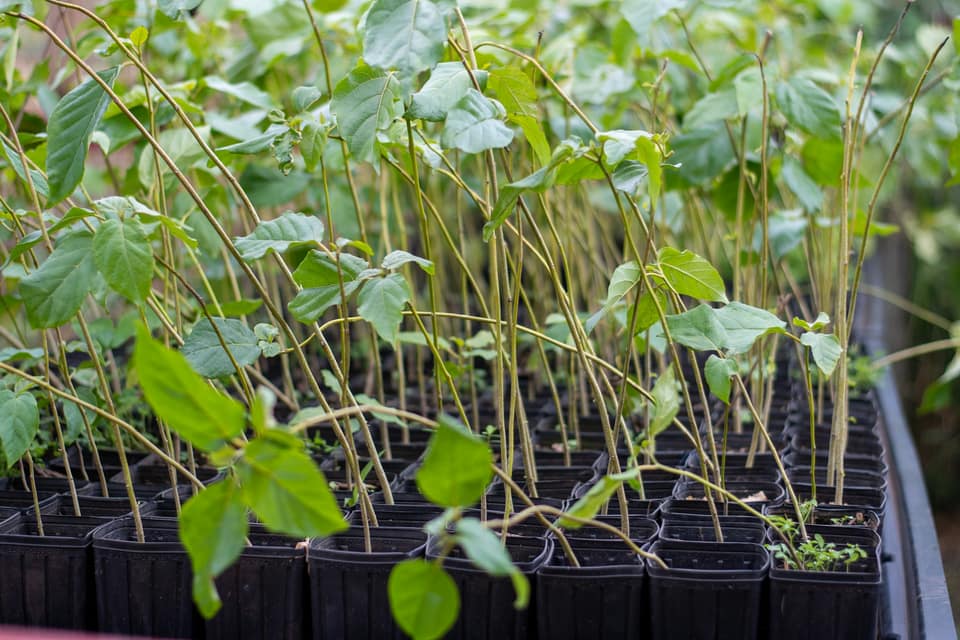
Young trees in nursery pots
Photo by T.J. Breshears on Unsplash. Unsplash License.
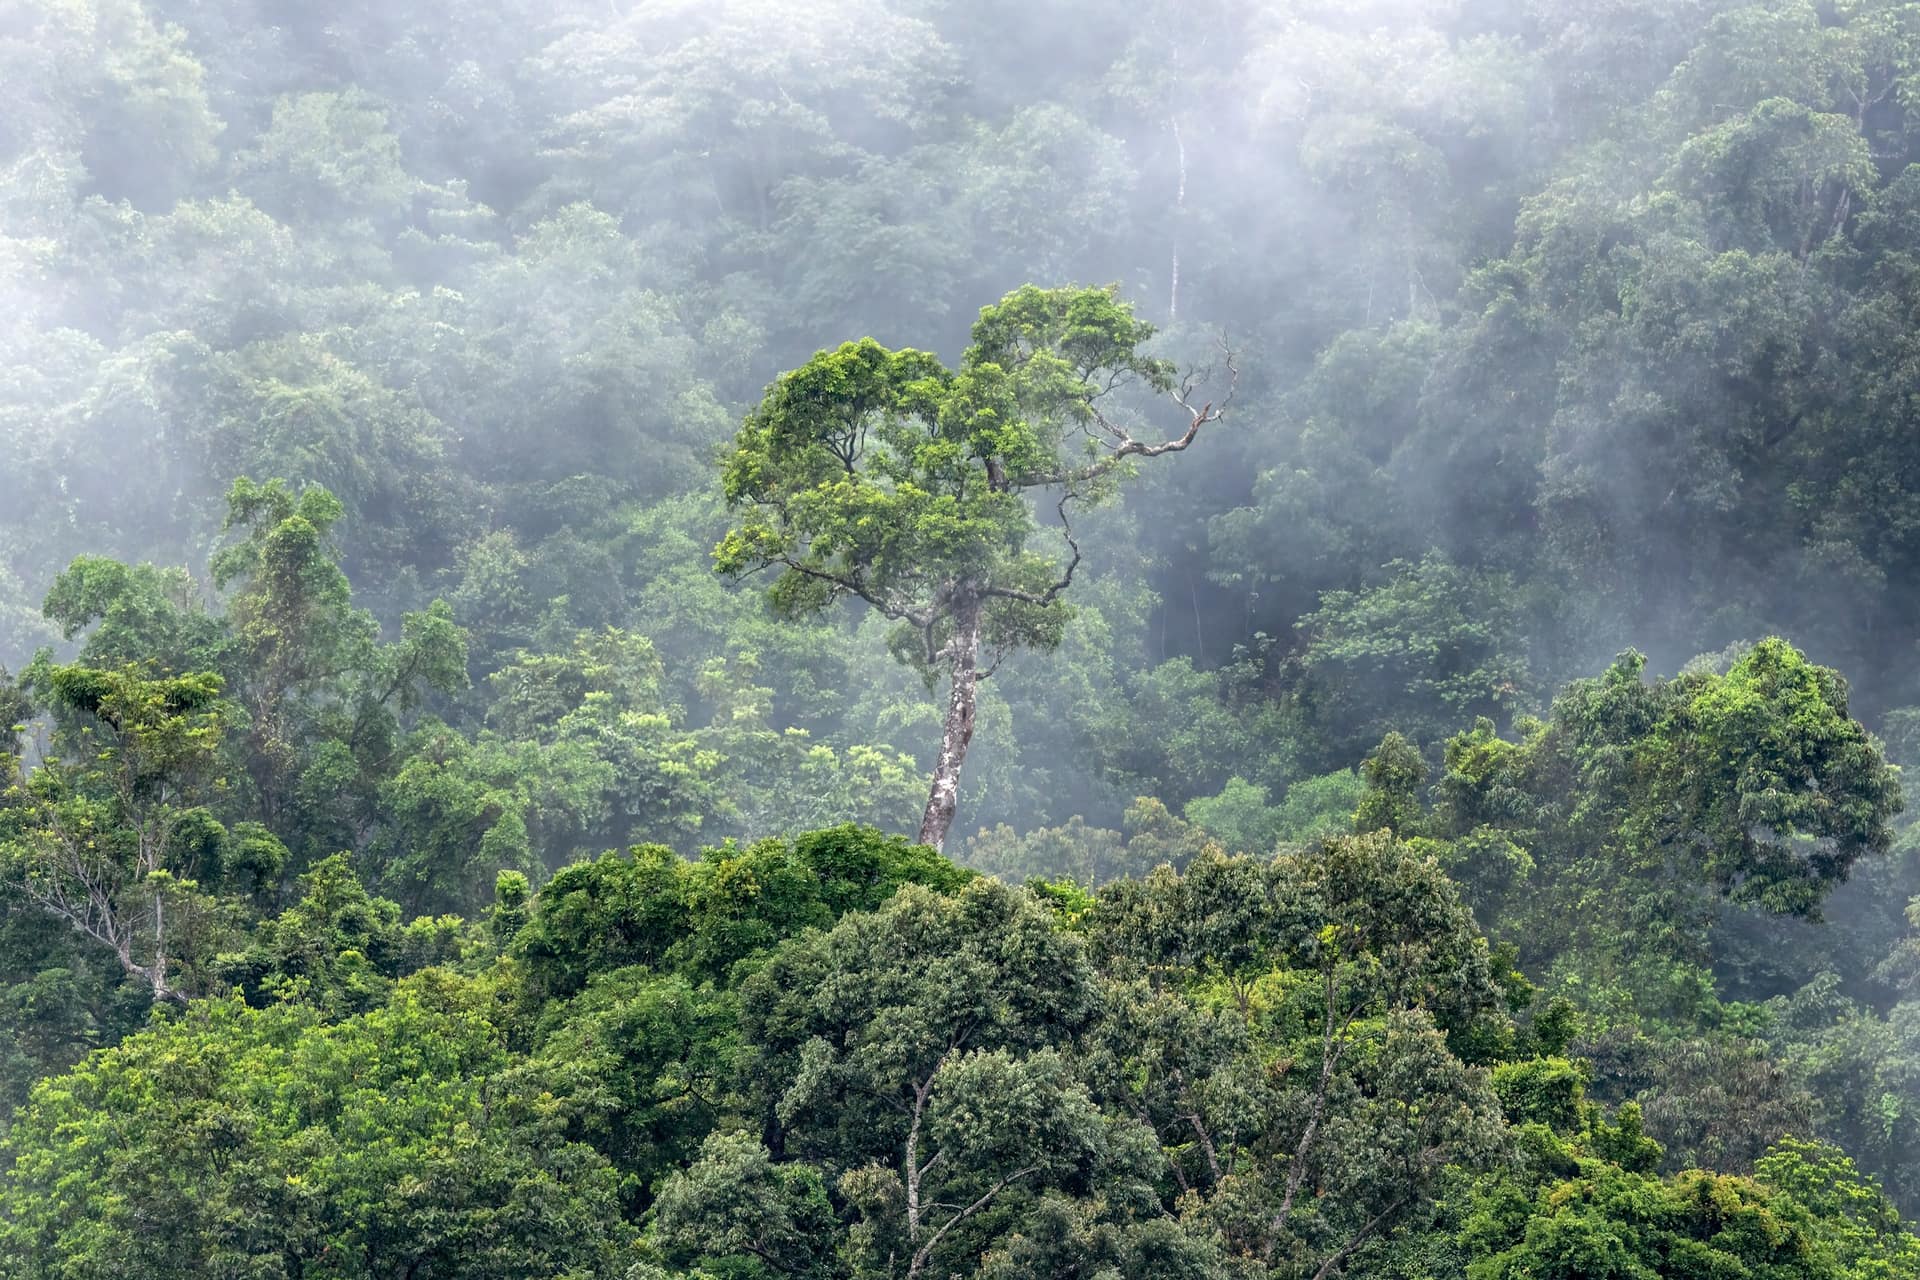
A tall tree rising above misty rainforest
Photo by David Clode on Unsplash. Unsplash License.
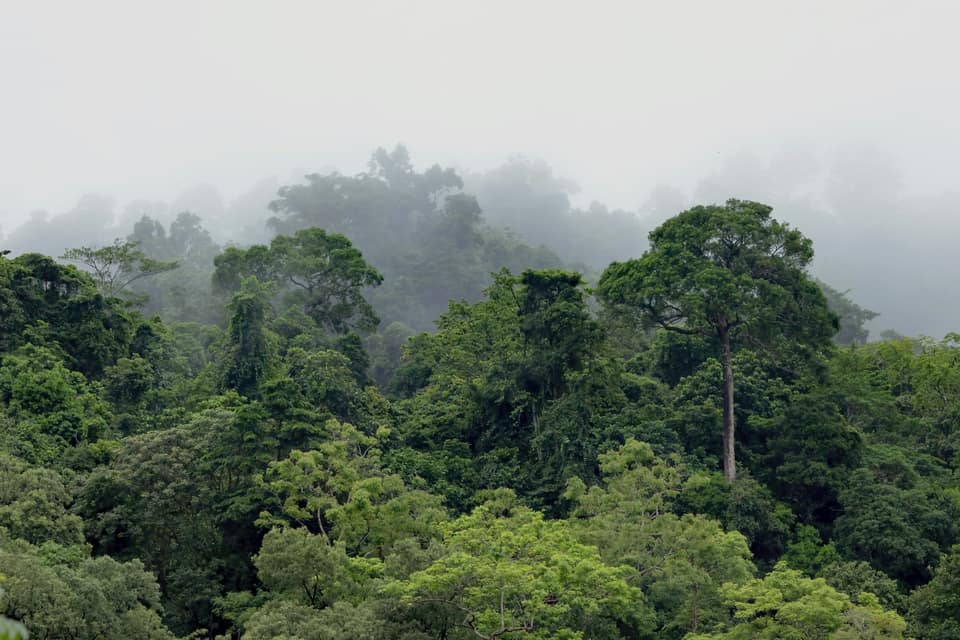
Rainforest canopy with mist behind
Photo by David Clode on Unsplash. Unsplash License.
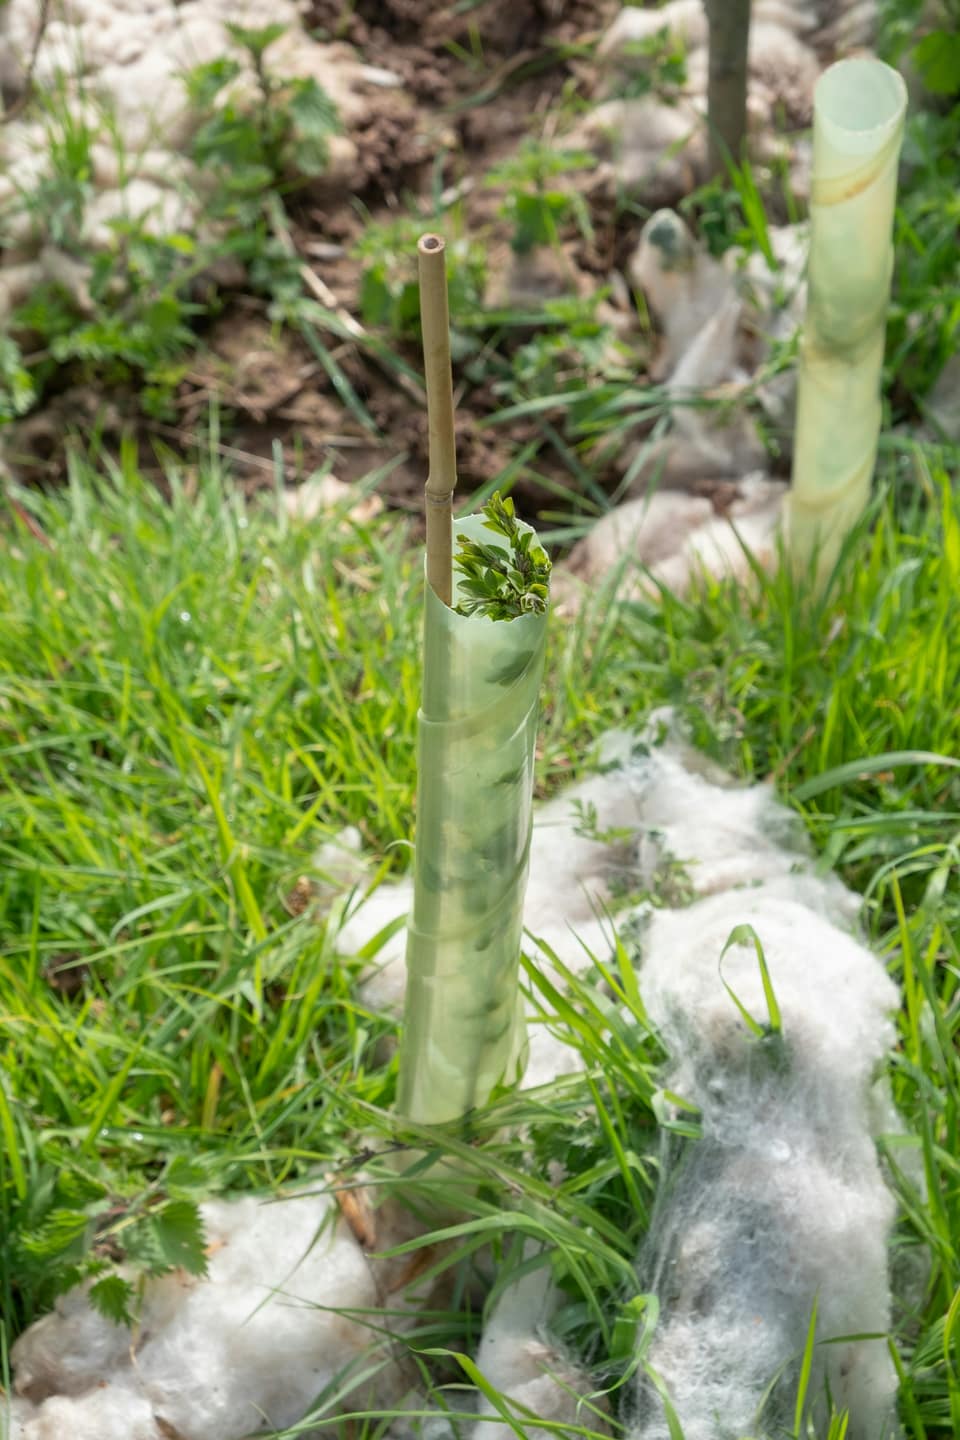
Young saplings in tree guards among grass
Photo by Veronica White on Unsplash. Unsplash License.


The figures behind the footprint calculator.
- Petrol, diesel, LPG and natural gas, for a company's own fuel useUK Government greenhouse gas conversion factors, 2026 edition, flat file (revised July 2026). Open Government Licence v3.0.
- Travel and flightsUK Government greenhouse gas conversion factors, 2026 edition. Open Government Licence v3.0.
- Electricity, every countryEmber, carbon intensity of electricity generation, via Our World in Data. CC BY 4.0.
- Electricity, Malaysia by regionEnergy Commission of Malaysia, grid emission factor 2022–2024 (provisional)
- FoodScarborough et al., Nature Food 4, 565–574 (2023). CC BY 4.0.
- Country averagesGlobal Carbon Budget, CO2 emissions per person, via Our World in Data. CC BY 4.0.
- The 2030 level1.5-Degree Lifestyles, Hot or Cool Institute